Maintenance of the monitoring software that we have been using has just expired. I stumbled on Adrem Software NetCrunch monitoring and visualization system which is used to monitor networks, applications and devices. What a great opportunity to review and write a NetCrunch review. Curiosity has led me to find some really amazing products in the past and I have a feeling, that this time I found one such product.
In our environment, we use physical and virtual servers, firewalls, switches and computers. It’s a pretty standard environment. The only exception perhaps is that we have many locations and remote warehouses. We work every day in the week and our working time is from 8:00 – 20:00.
When I talk to my IT friends, they don’t have many important workstations. Workstations that are deemed important for their business with the exception of directors. We have.
We have cash desks which have to be operational, we have workstations in the warehouses, manager’s computers, they all need to work. When they fail, it’s a big problem. So it’s important for us to know when we might have a problem and prevent it if possible.
So we need to be proactive.
Adrem software NetCrunch review
How do you judge a product? For me, all the aspects are important: Installation, look and feel, features, ease of use, stability, usability and price. Let’s take a look at the NetCrunch installation.
Product Installation
NetCrunch is very easy to setup. First, you have to download setup files and once you start installation you are done in a matter of minutes. All you have to do is to enter the credentials of your network and off you go.
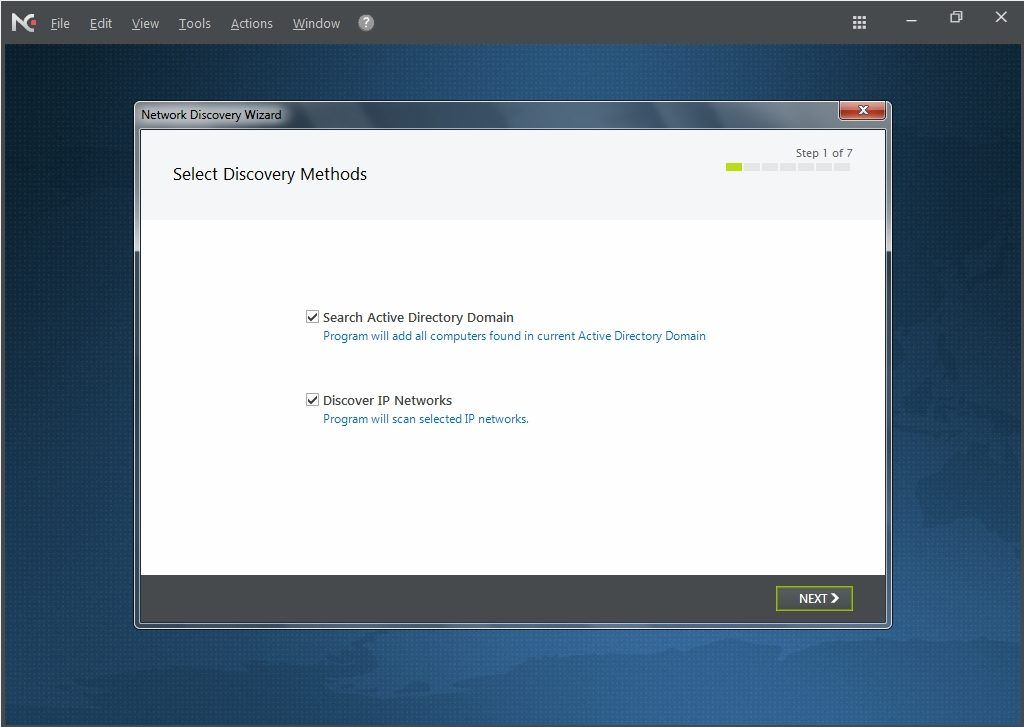
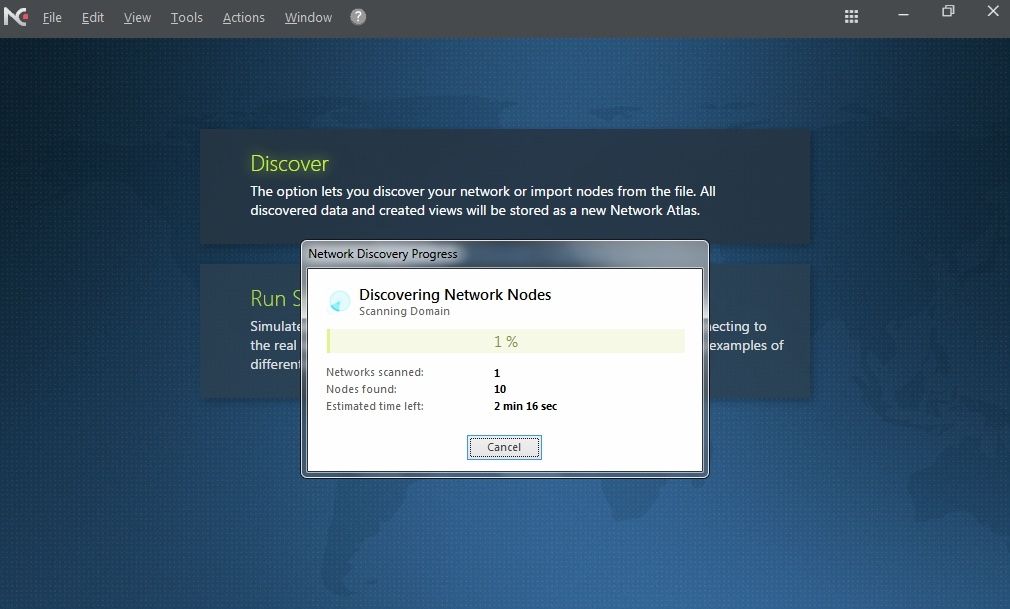
Before you can say cheese, it starts a discovery process. The network monitor is just a beginning. You can use Netcrunch to monitor your Windows environment (servers and workstations) Linux devices, Unix servers, IP telephones and the list goes on. Depending on your environment size discovery process will be almost instant or if your environment is bigger with many remote locations it will take a little bit longer.
All information at your hands
In IT department, we have a 42” LG television on the wall in the office. It’s purpose is to show information about infrastructure we support and manage. That way technicians are able to see immediately where is the problem and can review the situation. We also use TV on the meetings when we discuss anything related about equipment and configuration.
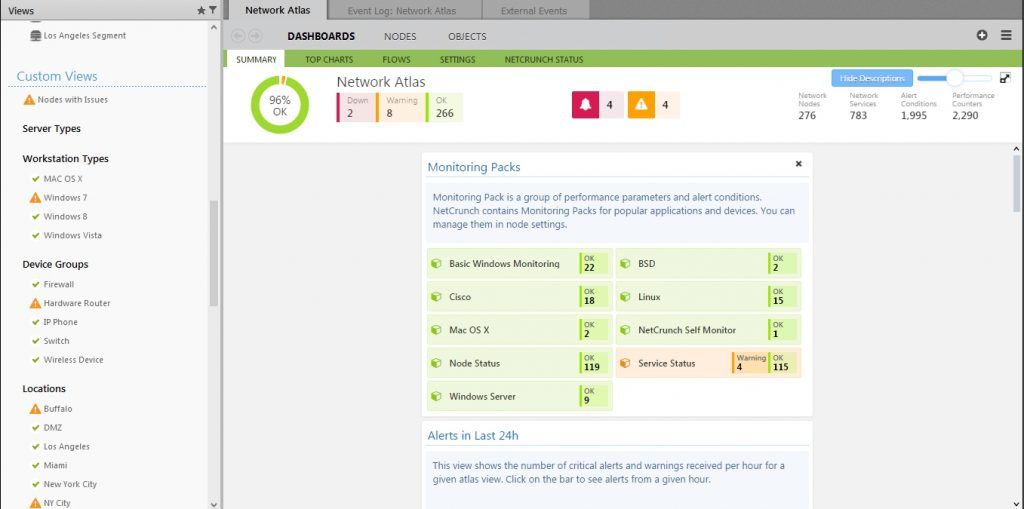
NetCrunch is great in such scenarios. On the pictures below, you will see how Network Atlas presents information on the summary view. In general, it’s important that all the fields are green. If color is other than green, we have to look into the problem. Any category can be expanded so that even if you see a red spot, you can drill down and find the problematic device easily.
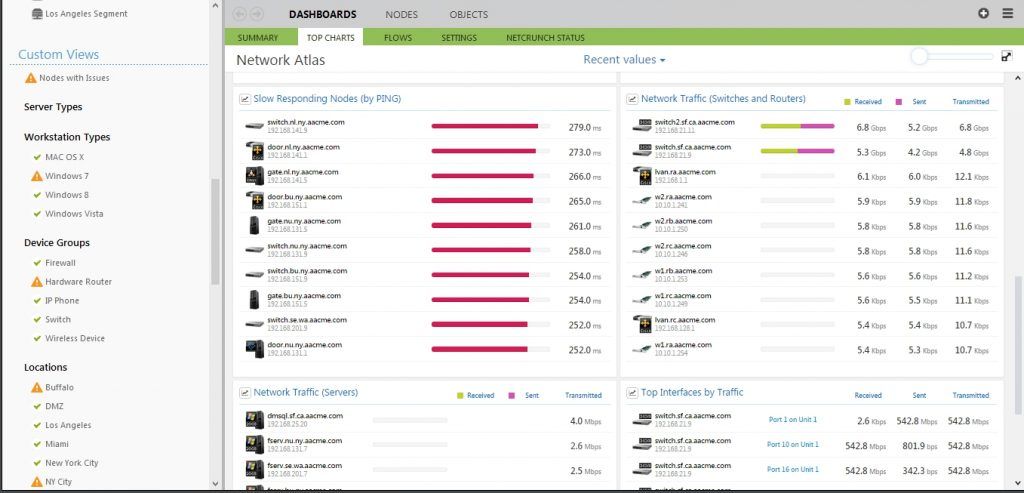
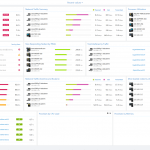
When you are reviewing your environment, it’s essential to avoid unimportant information. I really don’t care If I have to manage 1000 computers, 100 servers and 100 switches. But I care if 10 devices have problems. Problems may not be critical, but they can become soon. That is the case with the Top Charts view. Here you can see the most utilized nodes. For example, you will see which devices have slow pings, highest network traffic, which disk or memory is the most utilized and so on.
This view also comes handy when you receive a call that the internet on a remote location is slow. Or that devices in that locations have a problem accessing the server from the main location. Why?
Because, you will quickly find devices that are the most utilized, you will see what is the problem in instant.
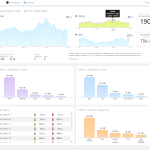
Which leads us to the second advantage. Using the OpenFlow protocol, NetCrunch is able to serve you all the information in your environment in a neatly organized dashboard. It can be maximized so that makes it perfect for the big screen TV in your office.
Now, let’s hold our breath for the moment. Exactly what information do you need from your nodes? Imagine that you can mix and match any metrics and create a perfect report? This takes some thought.
Out of the box, you are able to see information about the traffic, active nodes, transmitted data, the most active ports, traffic by application types – where you can see which application takes the most bandwidth in your environment and even which ports are used the most.
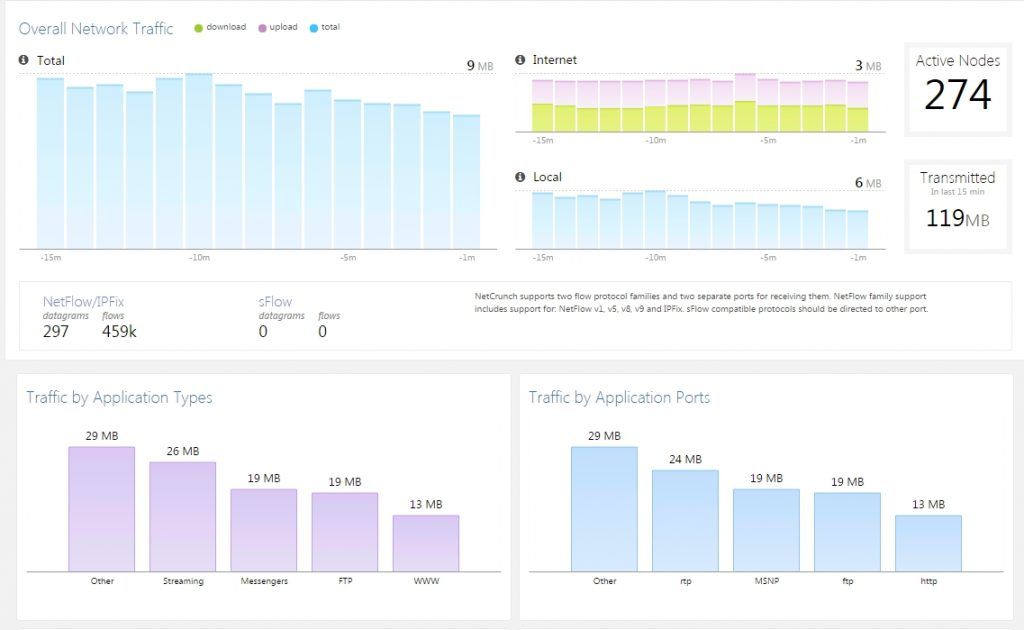
Houston, we have a problem
I think that in general, most problems can be avoided if you review logs. It does not matter if we are talking about the network devices, Windows servers or even Windows Cash Desks. Do you agree?
Now, the problem is that reviewing all the information takes time. Especially if you consider that you are reviewing both, perfectly healthy and problematic devices. So, if majority devices are in a perfectly healthy state, why would you spend time looking for problems on them?
I know. One of the features which will prevent you from such cases is built right into the dashboard. Better yet, if currently you don’t have time to look at the logs at all, NetCrunch Network atlas has a great feature for such problems.
Here all the problems in your environment are listed. Yes, that is better. Focus your time only on the problems. You can select a location and it will list all devices.
Yes, that is better. Focus your time only on the problems. You can select a location and it will list all devices.
One of the features which will prevent you from loosing time is built right into the dashboard. Better yet, if currently you don’t have time to look at the logs at all, NetCrunch Network atlas has a great advantage for such problems. Here, all the problems in your environment are listed. Yes, that is better. Focus your time only on the problems. You can select a location and it will list all devices.
You will see a list all devices in a selected location, most will have a green status, but you will easily spot problematic devices.
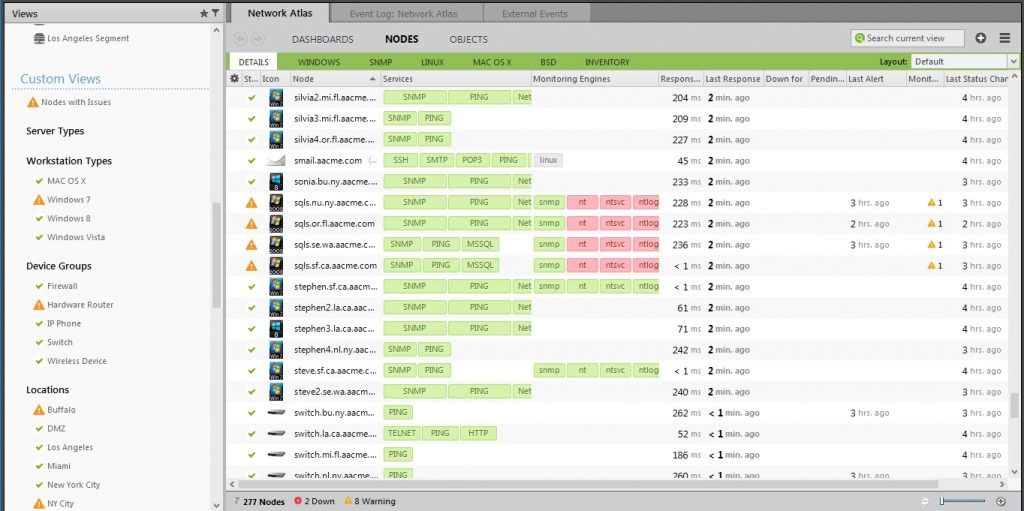
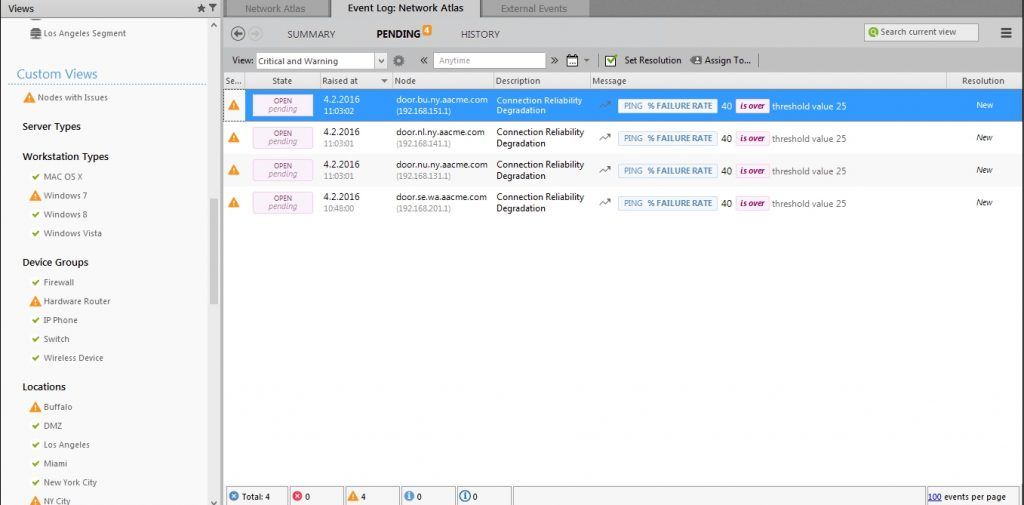
Then if you need to see which services are degraded, you will see in the Log view exact problem that devices have. You will see problems with connectivity, which nodes are down and so on. Since this is a log view, you will also see exact time when the problem occurred. Very useful for looking at history and events. One example when this comes handy is when you have a maintenance agreement for network devices for example. If the service was not restored in the time defined in the contract, a vendor would have to pay the penalty.
Mapping your infrastructure
Have you tried creating a map of your environment? If your infrastructure is small it’s easy. As soon you have several locations you have a problem. Especially if your company starts to expand, you better find a software solution which will save you some time.
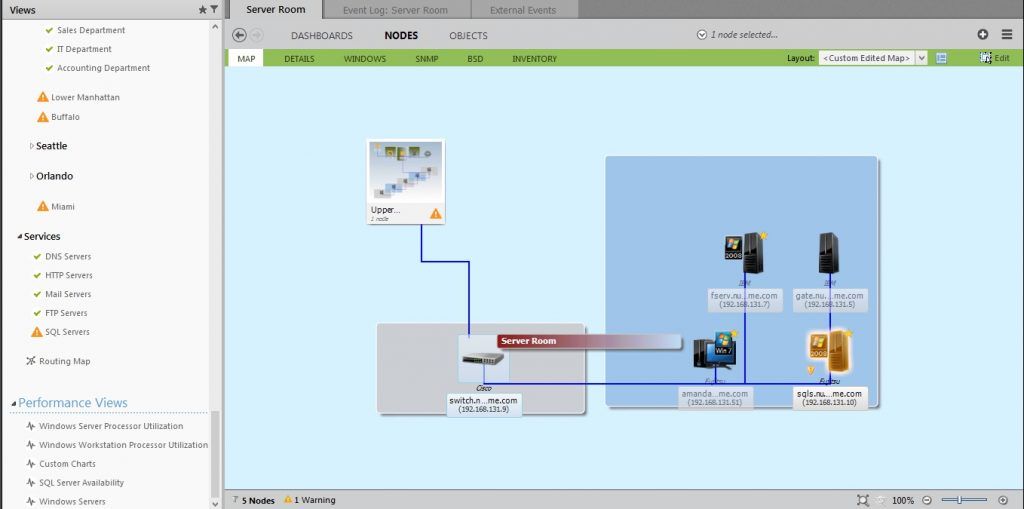
I like how NetCrunch presents devices. You can zoom in and zoom out of devices which are grouped by location.
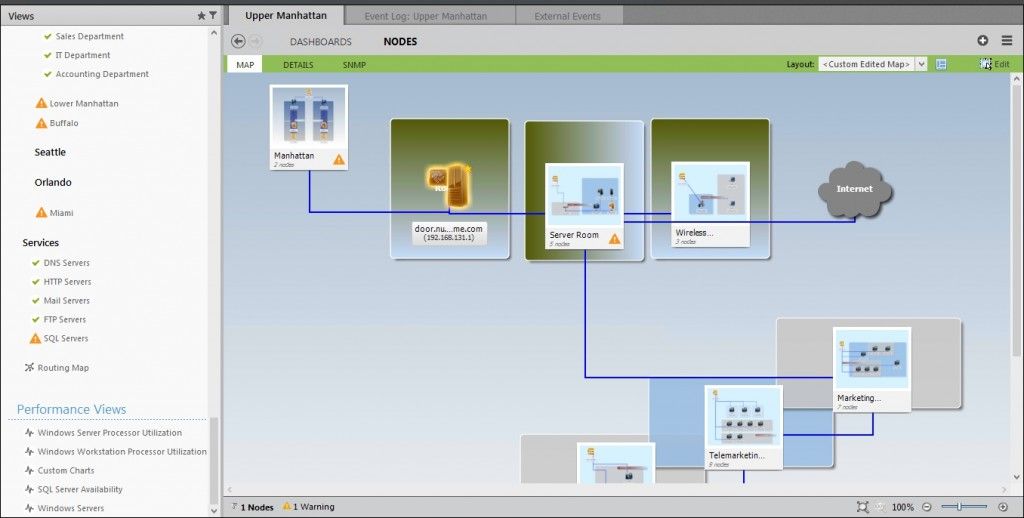
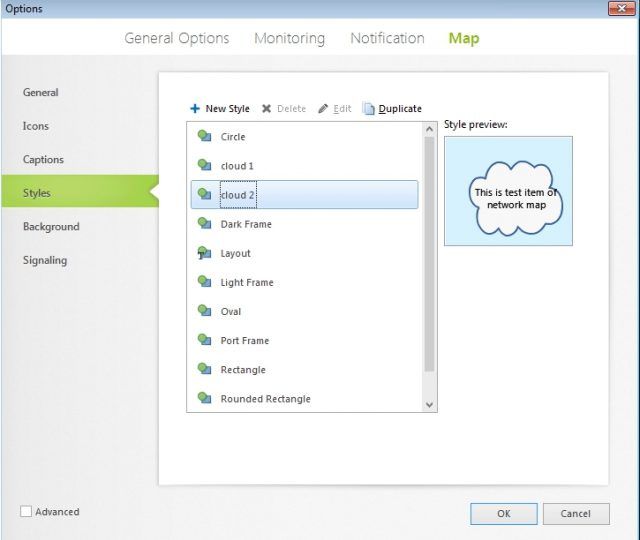
And you can select your own icon style for objects. Speaking of graphical objects, recently Adrem software completely redesigned icon set for devices and objects.
More things to like
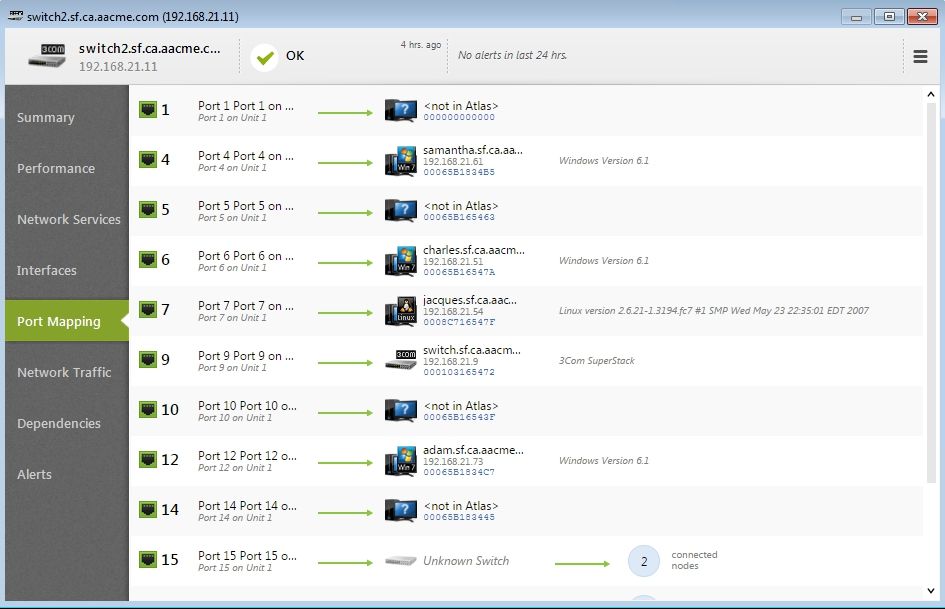
Do you ever wonder how a PC is connected to the network? Maybe you were trying to locate a port where a computer was connected only to find that locating the right cable will be a difficult task. With Port Mapping feature, you can find relations between devices like computers and switches. It comes really handy. From a documentation and operational perspective.
NetcCrunch can also monitor Windows devices. Cashdesk, directors computers, and Windows servers for example. Before I started playing with netCrunch, I wasn’t aware of some problems I had with the servers. Having a well-rounded solution is great for saving your time and spending less time on monitoring.
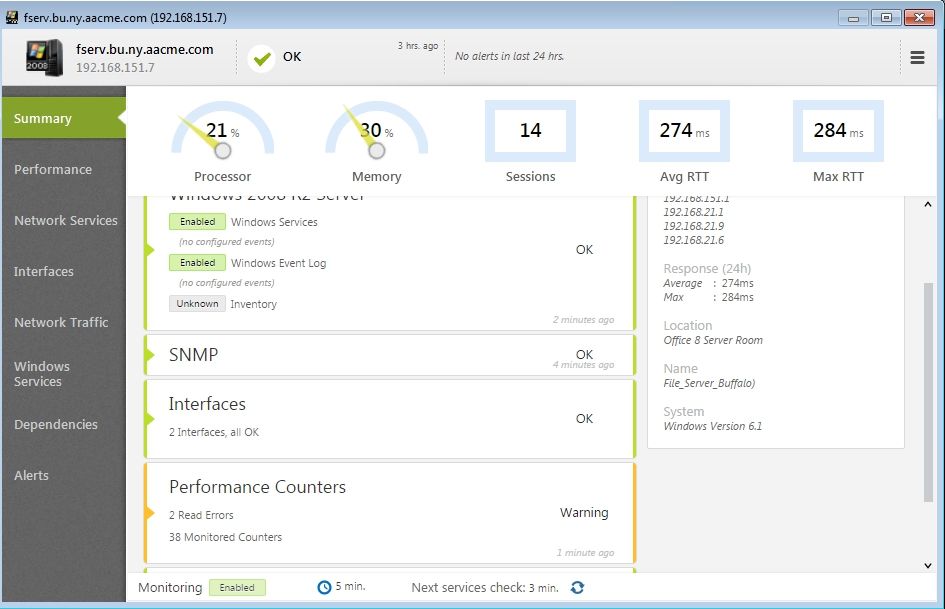
Netcrunch is a complete monitoring solution
I touched on only a fraction of features. The product can be used in small environments, but it will shine in the largest environments just as well. It can monitor:
- Windows servers
- Windows workstations
- Linux servers
- Solaris servers
- VMware
- Hyper-V
- OS Servers and OSX Workstations
- Switches
- Firewalls
Installation requirements are pretty low, you only need 4 CPU cores and 4GB Ram to monitor 1000 devices. You can install NetCrunch on a Windows Server 2008 up to the latest version. Installation is fast and in an instant it will scan your environment. It will look at windows event log, Syslog, SNMP trap, it will monitor performance counters, uptime and service status, etc…
I have been looking for such solutions for ages. After the initial scan, I reviewed devices which have problems. I admit I wasn’t aware of the problems. I should. I know I should have been monitoring devices more often, but I don’t have time.
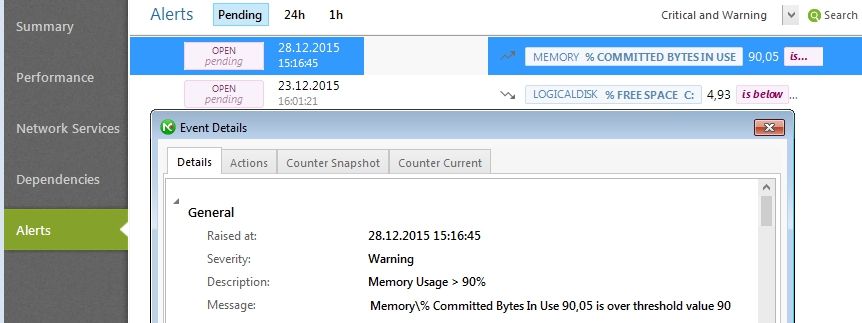
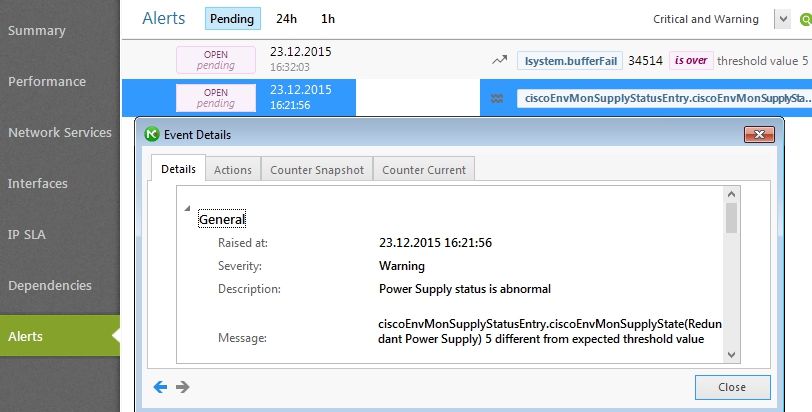
As you can see, I have missed two important events. If I hadn’t used NetCrunch, the situation could probably get worse. I was able to find problems and resolve the issues.
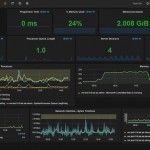
If you also have a television in the office for visual monitoring, NetCrunch also includes a special software which is a fork of open source Grafana project. Solution is ideal for NOC or monitoring objects.
You can look at couple of examples I found on NetCrunch website which can show you better how you can create your own NOC style dashboards.
I also found a video on their site which I think can show you in a minute how easy it is to use NetCrunch and the value you get. Video is narrated by a cool dude and he only talks about the facts. There is no marketing BS.
Learn to forgive yourself
Let me tell you something I didn’t share with anyone, until now that is. While I have a great track of successful project behind me and I did some amazing achievements, I also admit I did some mistakes. Mistakes that caused downtime. Either I forgot to review event logs, configuration, test backup or didn’t test changes properly before going live. Things happen. I also admit I felt terrible. I couldn’t sleep. There were also times when I was working late in the morning to fix the problem. Then going to the office without sleep. But looking at my past, I learned to forgive myself. Things happen. Because of bad experiences, I became better, wiser.
Why am I telling you this? Because I know that you might have a similar experience.
I could have spotted the issues with Cisco switches, but I didn’t. I could have spotted the problems with backup repository but I didn’t. I could have spotted problems with SQL server but I didn’t. Maybe I didn’t have enough time to look at networking situation. Or I didn’t have the right tool to filter and present only the relevant information.
Time. An issue in every company. I see my friends have less time, the same or smaller team but more users to support. Optimization in the business they say.
How do we compensate for less time? The answer is:
Better software and automation. If I use a monitoring solution that enables me to spot the problem before it becomes a disaster, I can focus on other issues. I don’t have to spend time monitoring equipment and it’s sensors.
Now, here is the paradox. If I am using some sort of network monitoring software I think will have more time, but If the software doesn’t present relevant information, disaster could happen. And guilt along with it. On the other hand, If I use the right software, I will think I I will have more time and I could really prevent a disaster.
Thank you, I think I will rather choose the right software.
NetCrunch Licensing and pricing
NetCrunch is licensed per device you monitor. You could monitor all the sensors on that device and it will still count as one. We used an application with per sensor licensing and let me tell you the pain we had once we start adding more switches.
Why? Each switch has at least 24 ports. If you use switches with 48ports you can quickly see a problem. Let’s say you add 10 new, 48 port switches to your infrastructure. That means 10 x 48 ports + at least 4 environmental sensors per device. That is 520 sensors, even though you only use 10 switches.
NetCrunch per device licensing clearly wins here. What about prices?
- NetCrunch 50: Up to 50 nodes: $1,755
- NetCrunch 125: Up to 125 nodes: $2,855
- NetCrunch 300: Up to 300 nodes: $4,395
- NetCrunch 600: Up to 600 nodes: $6,700
- NetCrunch 1000: Up to 1,000 nodes: $8,245
- NetCrunch 2000: Up to 2,000 nodes: $13,190
- NetCrunch Unlimited: Unlimited nodes – licensed per NetCrunch server: $17,590
- NetCrunch Corporate: Unlimited number of NetCrunch servers: on request


The licensing has changed with v10, and they now price it per interface which is unfortunate since its now more expensive than PRTG’s sensor costs. 500 interfaces was quoted to almost $9000. Given they still have very limited out-of-the-box device support I think they shot themselves in the foot jacking up the cost like that.