I came across Foglight NMS last year, in the summer, when Quest was offering Free licences. Idea is great, give potential customers some small amount of licences and when they get used to the product they will buy it. While this was a case last year, Quest decided to stop that promotion. Well fear not, you are still able to download 30 days trial so that you can evaluate the product.
Monitoring with Foglight NMS
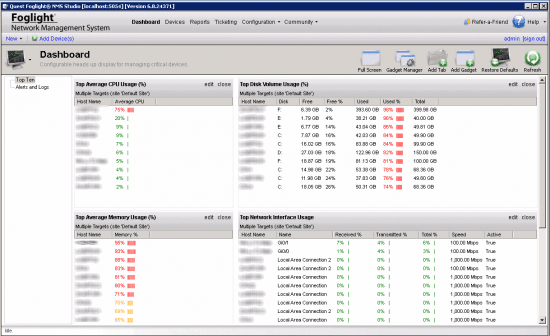
First thing you will see when you open Foglight NMS is dashboard. There is a list of all devices in your environment. Best thing about dashboard is that devices are listed based on top usage, for instance TOP CPU usage, TOP DISK VOLUME usage, TOP AVERAGE MEMORY USAGE and TOP NETWORK INTERFACE USAGE. Sorting in that way enables you to see potential problems quickly.
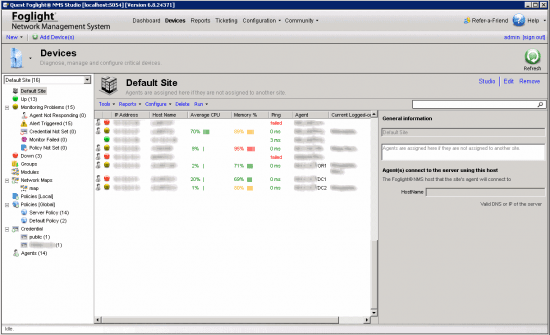
Devices view
Here are all devices listed, it also shows you some quick data like cpu, memory usage, ping, status of agent. On devices view you can also configure Maps, groups, credentials…
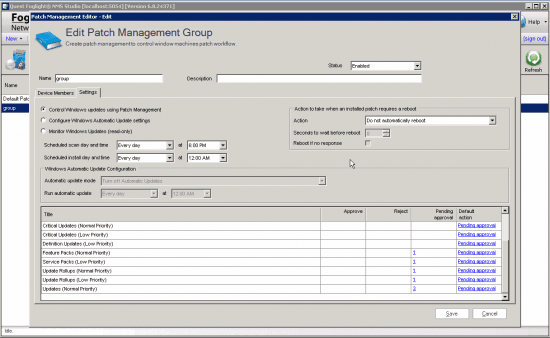
Feature I like the most is update feature – It can update your Desktops and Servers
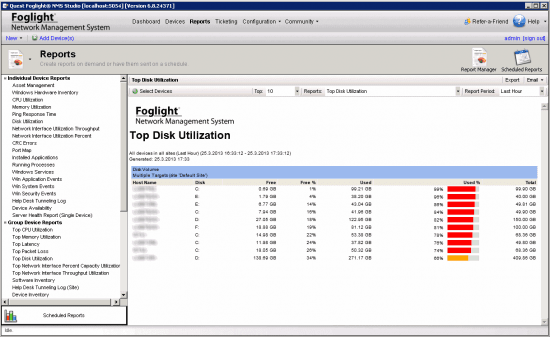
Reporting
Foglight NMS is very strong with reporting, it has a extensive list of reports, you can also schedule email reports, when I installed Foglight NMS for the first time and entered credentials I got email report in the morning, I was very surprised that it’s enabled by default, report had the most important data and it was like wow, this is what’s happening with my environment?
Product is very easy to setup and you can be up and running in less than 15 minutes.
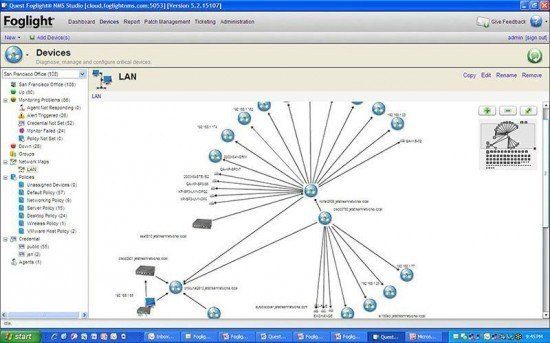
Port mapper
Ah, have you asked for Port mapper? Yes, device port mapper is included, Would you like to create nice maps? Yes, sir, no problem sir.
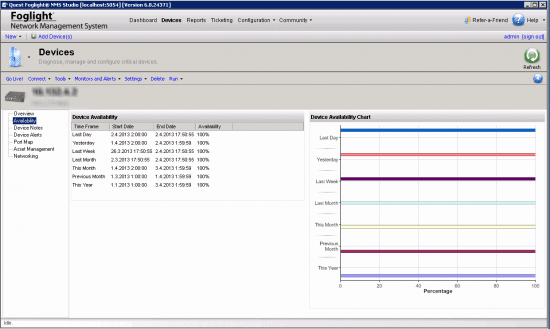
Availabity is easy to track and so are SLA’s
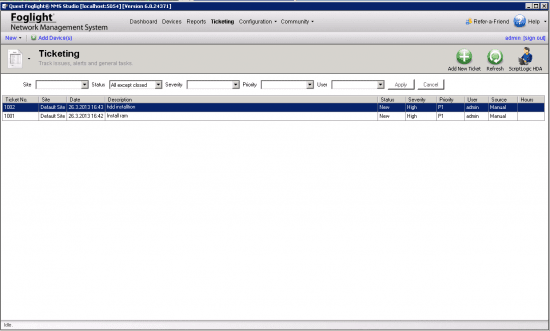
A bit uncommon but sometimes send from god is Ticketing feature, where you add request (tiny ticketing solution embedded in NMS)
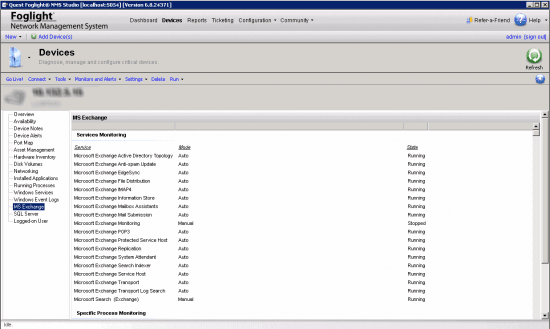
Do you have Exchange server? You will love Fog light, so many bit’s and pieces you can monitor…
Features of Quest Foglight NMS
- Configuration Management – Back up configuration files automatically for your routers and switches.
- Network Traffic Monitoring – Discover unparalleled visibility into traffic network patterns and usage through real-time packet capture to determine how traffic impacts the overall health of the network.
- Virtualization Monitoring – Experience the only platform on the market to monitor key statistics like status, CPU, memory, disk usage, and interface traffic on virtual machines across any number of physical servers.
- Wireless Monitoring – Monitor your wireless networks with ease.
- Baseline Monitoring – Analyze collected data automatically to identify changes in network behavior and establish a baseline that represents the regular and expected activity of a device and network.
- Syslog & Event Log Monitoring – Collect, analyze, alert, report, and archive event logs from Windows hosts, SysLog from distributed UNIX hosts, routers, switches, and other SysLog devices, and application logs from IIS web servers, IIS FTP servers, and MS SQL servers. You can also troubleshoot performance problems on hosts, select applications and the network.
- App & Server Monitoring – Experience in-depth visibility of running processes and performance counters for mission-critical applications, network services, and web applications.
- Patch Management – Manage and control critical Windows updates automatically to ensure that devices are protected with the latest security patches.
- IP SLA Monitoring – Configure IP SLAs automatically on Cisco routers.
- VoIP Monitoring – Experience in-depth and detailed monitoring of Avaya VoIP quality metrics (including MOS, jitter, packet-loss, delay, network utilization, etc.), combined with integrated network monitoring, giving you a single view and unparalleled visibility into all critical events impacting the network.
All in all, Quest Foglight NMS (now part of DELL) is very balanced solution for monitoring, if you have NMS requirement you can check Foglight NMS on Dell website.


Leave a Reply