Network monitoring for any environment.
I started a quest in finding the best solution that would fit my requirements. There are many great network monitoring solutions.
Just for the record, I will cover only the most important features, best would be to install and test the program if you are looking for a monitoring solution. One of the best ones in the market is Solarwinds NPN. Can PRTG compete? Can PRTG compete against Foglight NMS? Can PRTG give you an advantage over free Opsview NMS?
One of the products I found is PRTG Network monitor.
First time I have encountered PRTG was one year ago, when I tried it, I was kind of lost,
the whole UI was a bit strange to me, I was fiddling with it but decided I would postpone
review, I needed time, but time was something I did not have.
Finally, the time has come for me to give it another spin.
This time, I have chosen to test the upcoming version, the one which has updated UI.
It’s time: Review – PRTG Network Monitor with new UI
Boy was I surprised when I saw the same settings and same UI at login.
I was even more surprised when I noticed that even though UI was the same, I had no problems with it.
Everything seemed logical, I guess it’s small fonts and a lot of grey color that affected my judgment (just a joke)
Setting up
When you log in with prtg default credentials: prtgadmin / prtgadmin you are presented with Start Guru
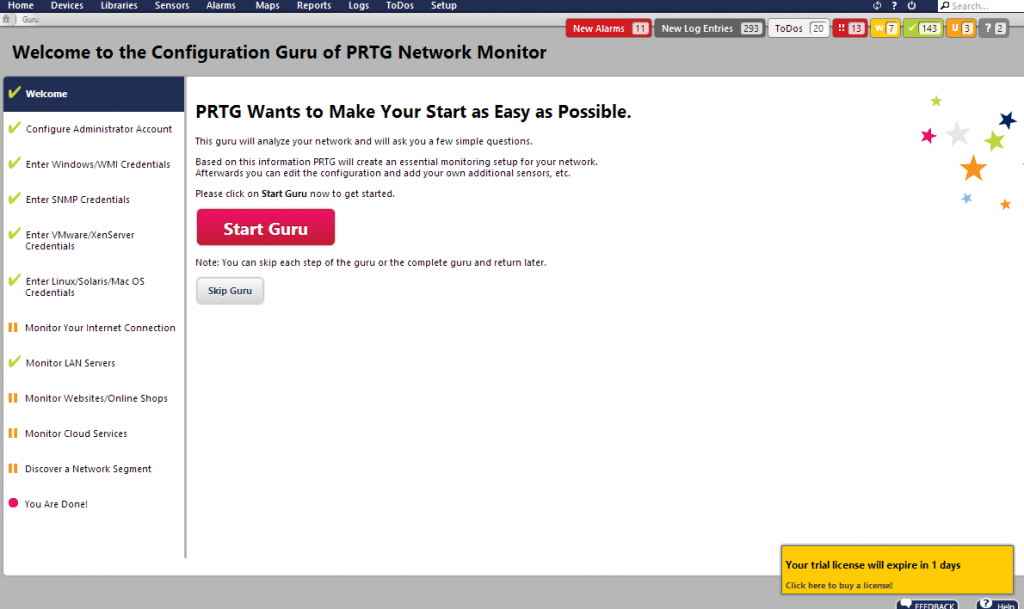
Start guru guides you with first steps, like entering credentials, IP range, types of monitoring…. everything that is needed so that you can easily
start with monitoring.
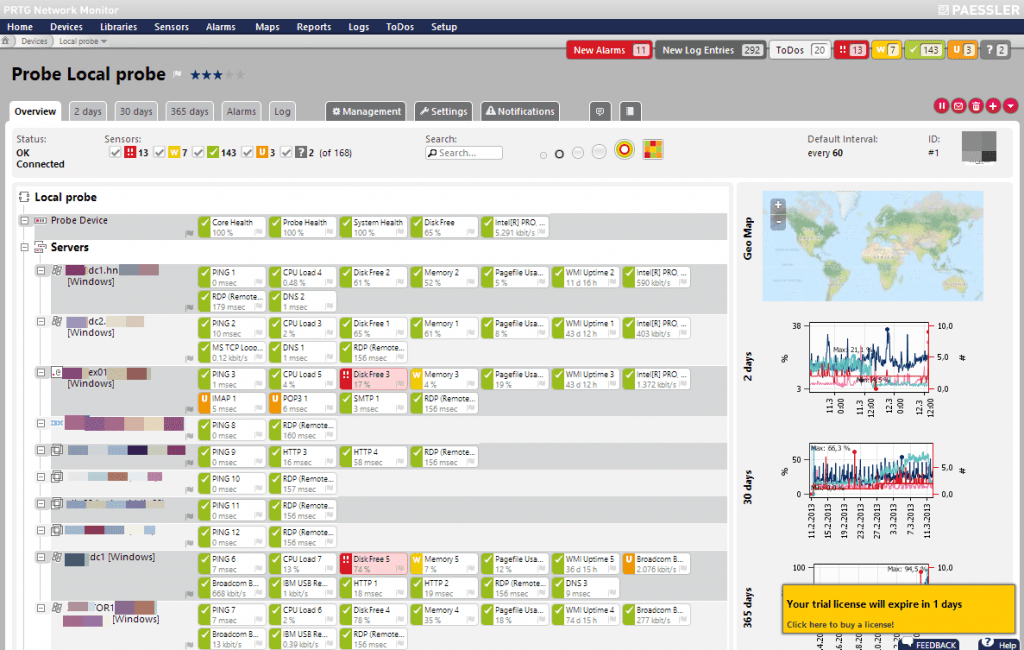
Once Guru does its work, you are presented with devices that are in your environment.
You can separate them via groups so that it’s easier to manage them and set views. (speaking of grey color
have you noticed % of grey on this screen? 🙂 nothing bad with grey, but I wish it had support for themes)
New features
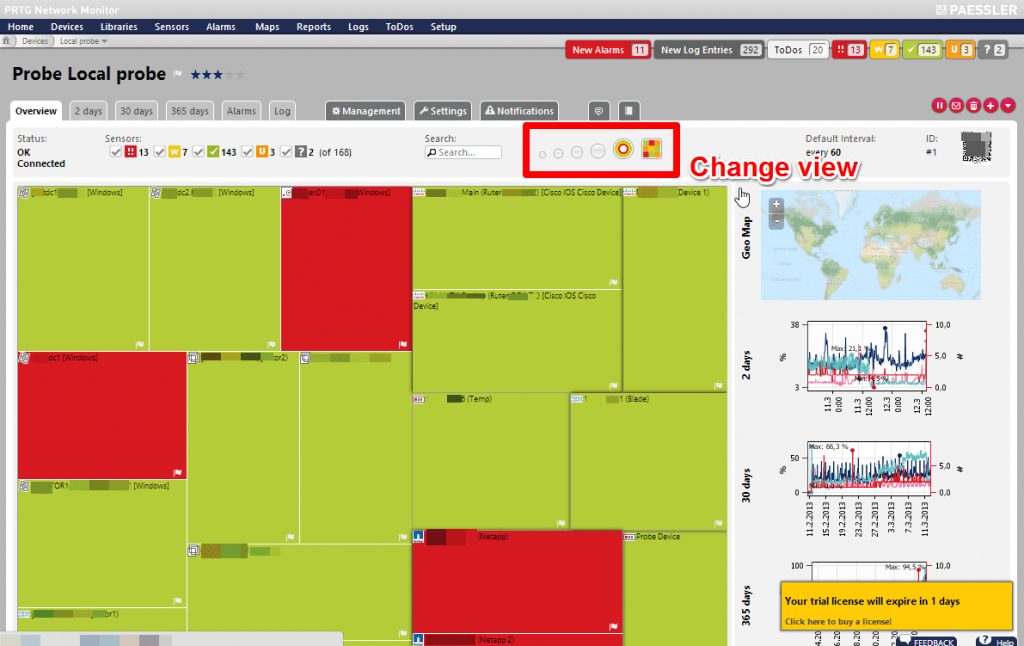
One of the new features in the upcoming version is a new change view button, where you can
change view – to smaller letters in order to fit more devices on the screen to bigger letters with a different view, they
have also added 2 additional views from their maps – one is a square with devices (the one you can see below)
and another with a shape of a circle – it’s very easy to fit a lot of devices inside and you can easily see devices that need
your attention by the color – green -ok, red – alert and yellow – requires attention.
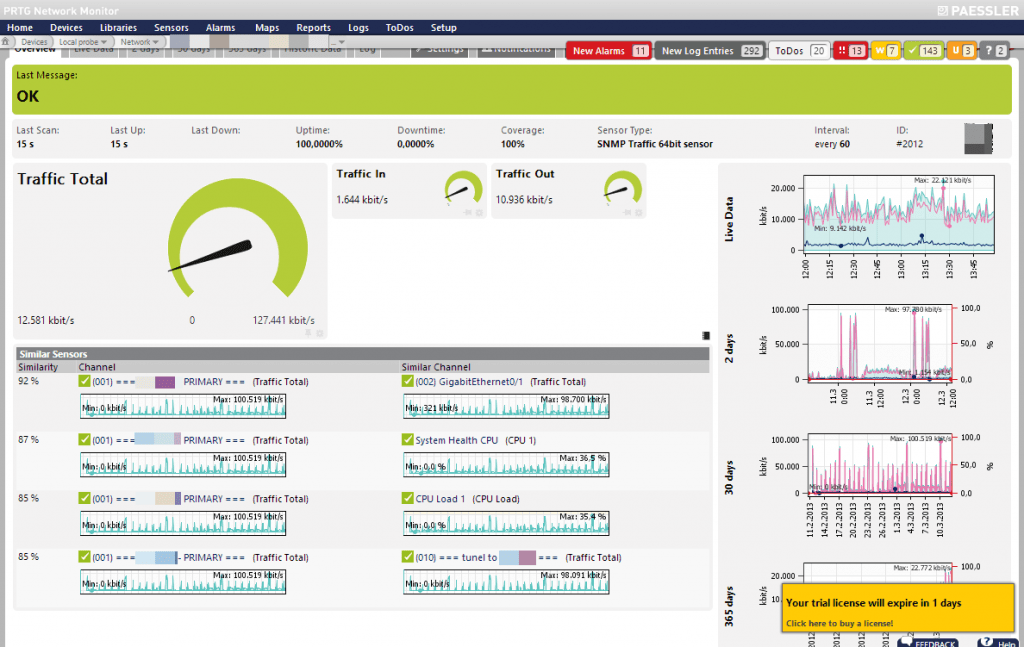
There is another neat feature in the new version – when you select a device in order to see detail, you are presented with an updated design, in line with modern standards set by BI, visualization and dashboards – You can see instantly status of the device.
If you are having some issues with the device and would like to pinpoint the problem, you can switch to 30 days (or 7 days) view,
it’s soooo good to have that feature – let’s say that you are having network problem (bad network card, or problem with the vendor)
or perhaps users are running reports at 15h – you can see repeating issue. Once you know the cause it’s easy to act on.
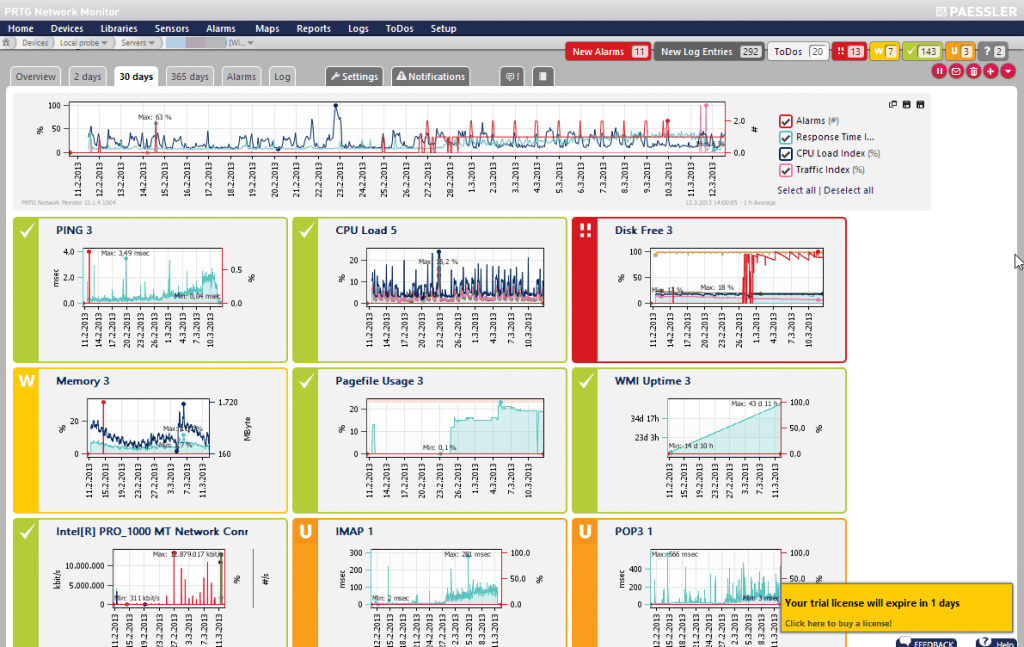
PRTG has presets of 3 dashboards – a view with information that is relevant for any admin, on that screen you can see alarms, logs, to-do’s, info that you can check and get insight what is happening with your devices?
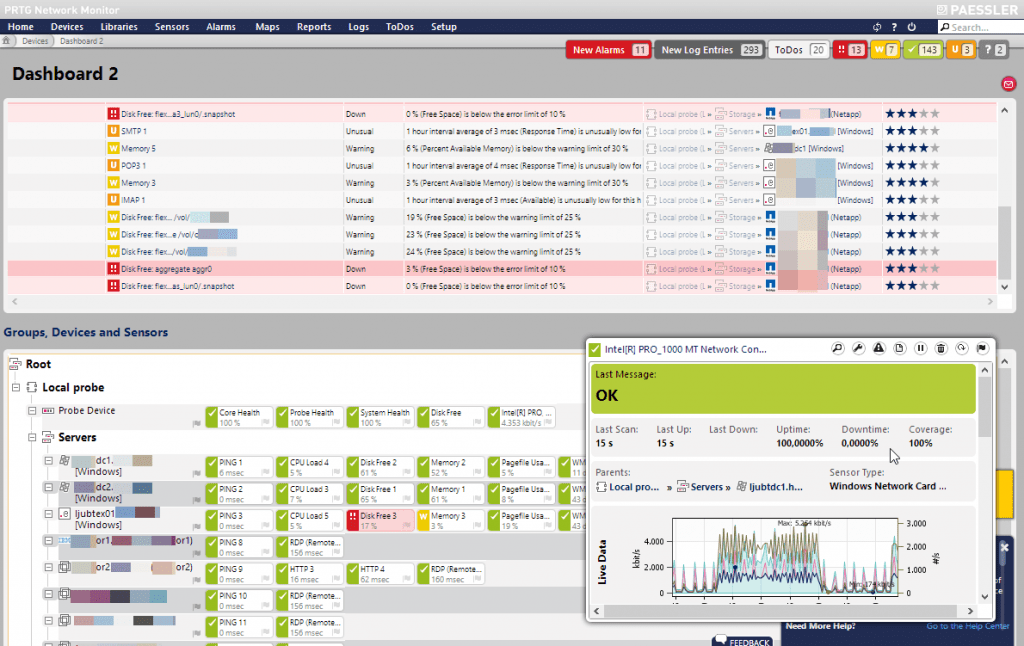
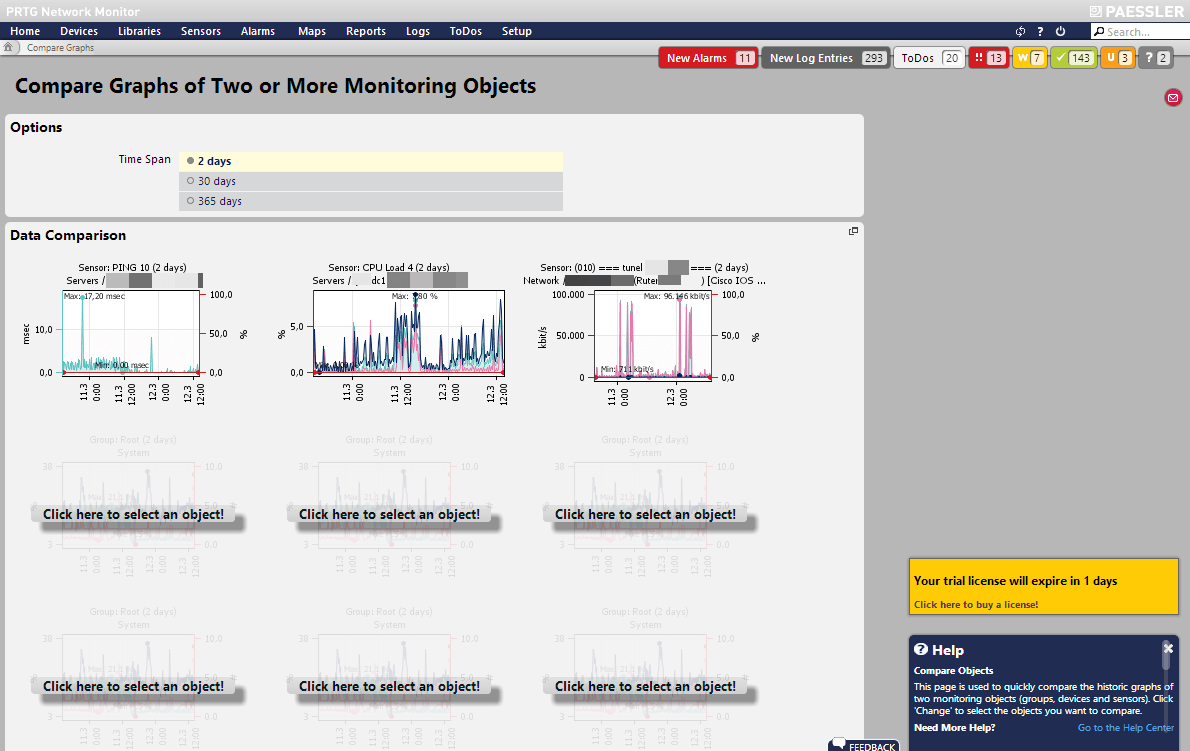
Another fine feature is a comparison of two or more monitoring objects, let’s say that you want to analyze why is one app so slow, you can compare 3 or more servers add CPU, network card, ram, HDD, you can add routers, switches…. and you get answers.
Map designer
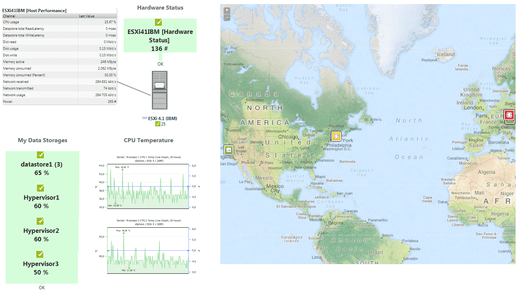
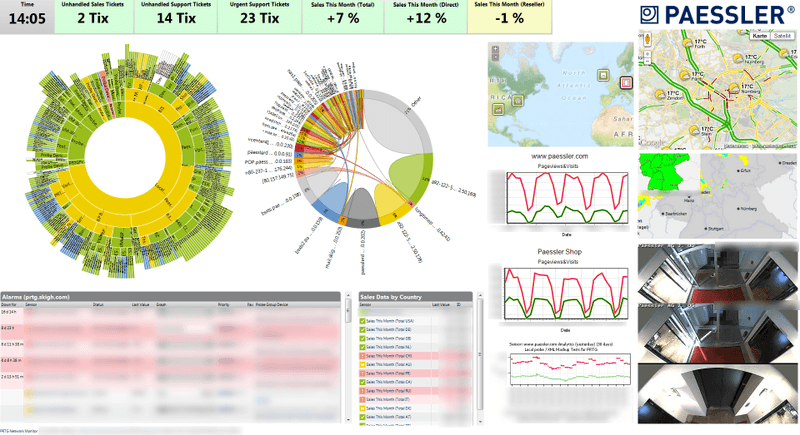
Map designer lets you design maps which you can publish as a website – either public or private, secured with the username and password. It’s very easy to create your own NOC screen. On the left side you choose objects (devices) and on the right side, you define what kind of view will be set for that very device. You can also integrate webcams, let me tell you, when your boss sees that screen, he/she will approve purchase 🙂
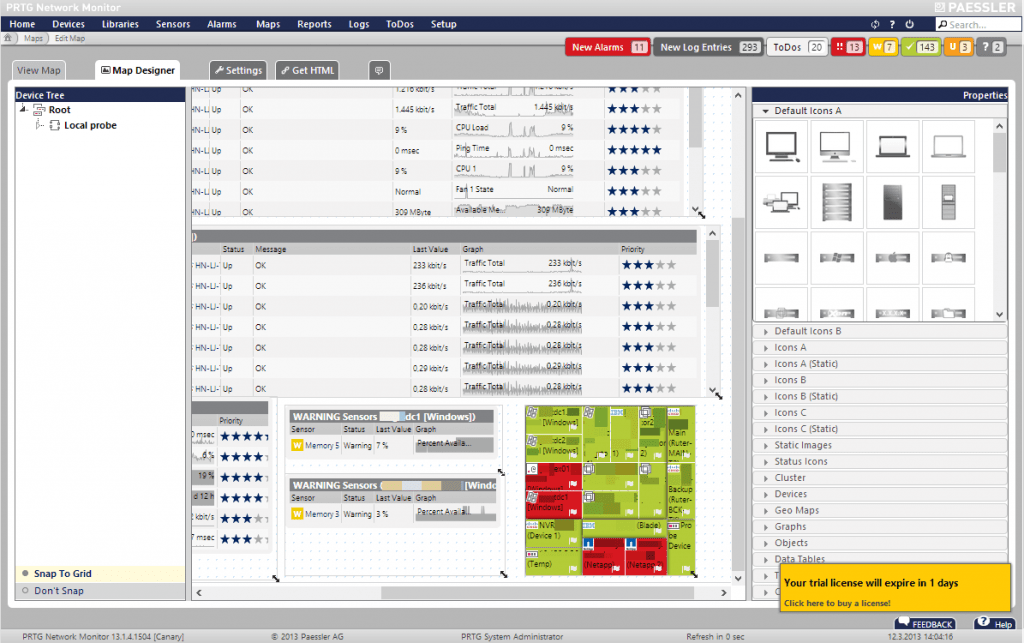
Map feature has a bug in this version and devices can’t be set, the one you see above was created in the latest version of the stable tree, the one below is one example of a map, created in PRTG, by the Paessler team.
Another example created and used by Paessler in their HQ.
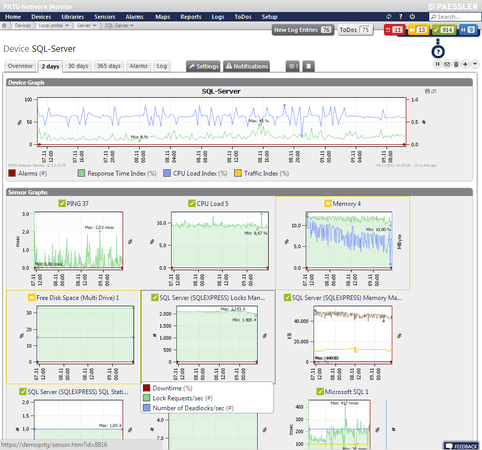
PRTG also has the ability to monitor applications, below example of SQL monitoring
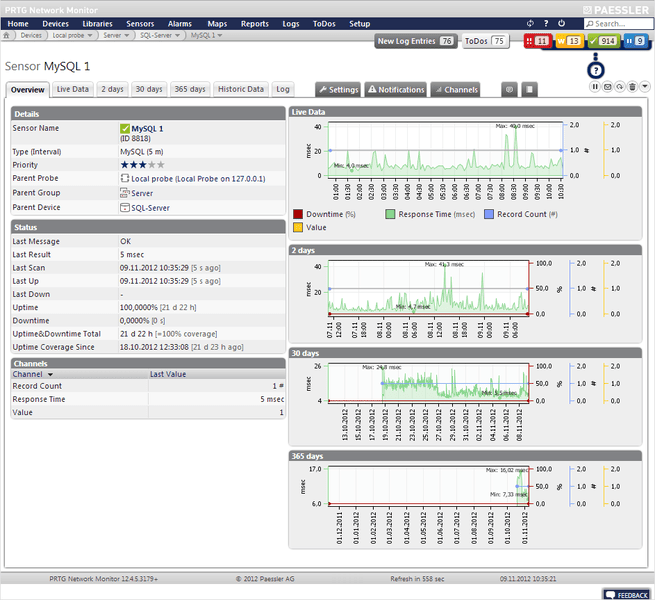
Example of My SQL monitoring
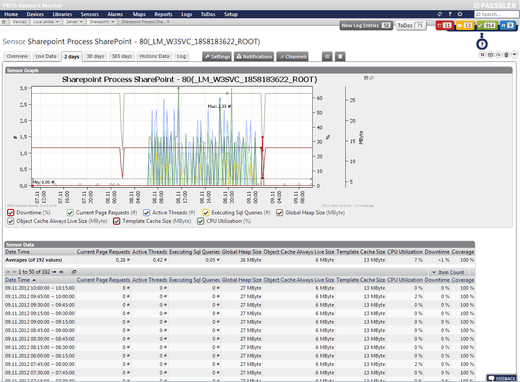
Example of Sharepoint monitoring.
Monitoring backup jobs
Last but not least is monitoring of backup jobs. You can easily create a monitor which will monitor Backup jobs.
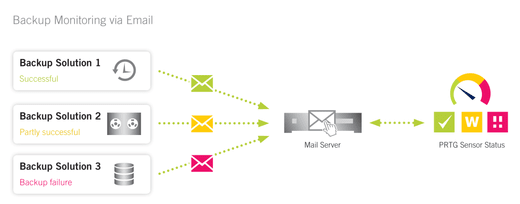
You create a sensor that parses email from a Backup job, you define which fields are relevant and set rule,
if this field is completed, then the sensor should be fine, if not failed.
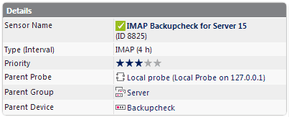
Speaking of sensors, you may have the device which is not included in PRTG, I had such a case with a temperature sensor for the server room. Well, they have a program for converting MIB files.
I went to supplier website, found the product, downloaded MIB file, imported to MIB Converter, converted it to PRTG type and voila. Very simple.
Now, a product itself is not enough, usually, before buying a program, I test the support and sales department.
Sales department
Sales could be improved, Lady who answered spoke English well, but she gave me wrong information about licensing, also she did not care about closing the sale. Usually sales reps. tend to get an email, telephone from customers in order to assist potential customers with additional info, support… until they buy the product. I noticed that European companies have a lot to learn from American siblings.
In the end, their website has a web store and you can make the purchase from there, no lady required. Perhaps it’s the sales model they choose, through the website, nothing wrong with that.
What about support?
It rocks, that is all I can say, please take a look at Mr. Patrick below:

He took good care of me, there was a camera that did not quite work for my maps,
he arranged a session with the developer, who fixed the problem.
Also for some other questions I had, he resolved all of my issues.
Some of you may not know, but Paessler is a German company, if you don’t know Germany, they are the ones
making Audi, Mercedes, BMW, Adidas, PUMA, HQ products, they also have good beer and they like sausages.
Pricing?
Licensing is sensors based, the sensor could be CPU, RAM, HDD, Network card… in this case that is 4 sensors.
depending on your environment, this can be either expensive or affordable, If you need to monitor 10x 48 ports on a switch – that is 480 sensors, if you need to monitor 10 servers with CPU, ram, HDD that is 30 sensors.
PRTG 100 Sensors US$ 476.00
PRTG 500 Sensor US$ 1,606.50
PRTG 1000 Sensors US$ 2,653.70
PRTG 2500 Sensors US$ 5,593.00
PRTG Unlimited US$ 12,852.00
I think that in general is quite affordable unless you have some special case.
Verdict?
I will buy PRTG for my environment, it works really well and the upcoming features are good.
You can get PRTG here


Thanks for this nice review. I am especially happy to read that you do like our latest redesign. We have put a lot of efforts into this and if it has helped you to get started with our software more quickly then we have succeeded 🙂
Dirk Paessler, CEO Paessler AG
Just a short hint for the pricing: Our new shop still shows prices including the German VAT also in the US. This will be fixed soon but also now you of course don’t have to pay the German VAT as a US customer. Just add the requested license to the cart and you will see your price:
PRTG 100 Sensors US$ 400.00
PRTG 500 Sensor US$ 1,350.00
PRTG 1000 Sensors US$ 2,230.00
PRTG 2500 Sensors US$ 4,700.00
PRTG Unlimited US$ 10,800.00
Sorry for that misunderstanding. For any license or price related questions just send a short email to sales@paessler.com
Best
Thomas
(VP BDM North America, Paessler AG)
For the price you pay for this, there needs to be telephone support. Other than that, I love this product.