Friend who runs IT shop called me on Friday: “Hi mate, I just received new switches, I would like to test them, can you help me with setting up monitoring solution, I would like to test couple of things“. My first thought was Cacti, but then I said, wait a minute, that is so old school, let’s try something new. There are many free products available, Nagios comes to mind as one of the most recognised. Problem with Open source monitoring is that while being good and reliable once set up, it’s a night mare to configure . Usability is also an issue as developers don’t consider end users interaction with the product. Then I remembered – Opsview, a new company that instead of developing a product, based resources around Nagios, improved what was bad and modified it to a great product.
Opsview Core
Opsview Core is open source „base“of commercial version called Opsview PRO. The „base“ is the same, but the PRO version packs additional features that are needed for serious monitoring. One of that features is Dashboard, screen where you see all important information being monitored. As my friend only needed to see interface utilisation, Core seemed perfect. There are times when you need to setup monitoring either with low budget or you need to do it quickly. Opsview core can match both of this requirements. One of the best features is that they provide Virtual appliance, that means that all you have to do, is to import it in to your Virtual Infrastructure and you are good to go. No installation manual,no installation, just run the product.
Opsview Core Features
Like I said, Dashboard is missing, but once you add devices, you can see a host group view, in example below, you can see that there are two host groups, one switches, the other servers. There are two statuses, one for host the other for Services. Host being hardware, services being services ran on the hardware. While it’s not a real dashboard it does provide you with general insight in to your infrastructure.
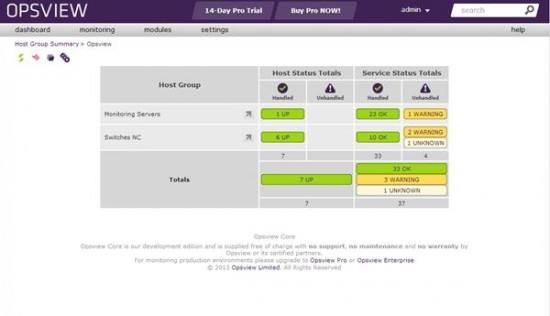
If you click on a host group you see devices that are part of that group.
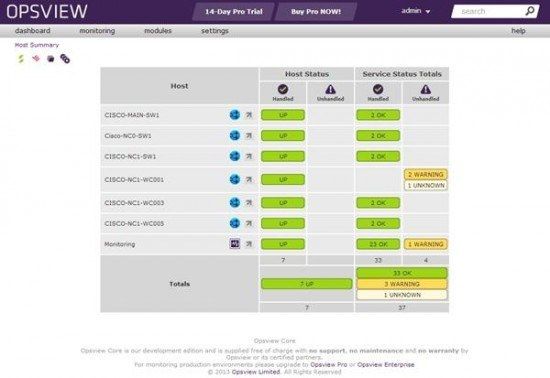
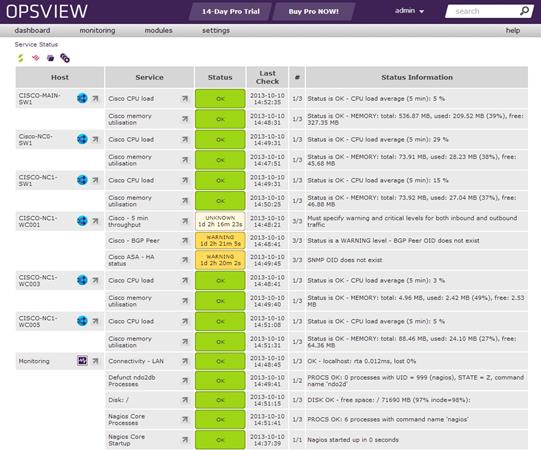
When you click on device, you are presented with a services view, here you can see if CPU load is normal, if memory utilization is within limit….
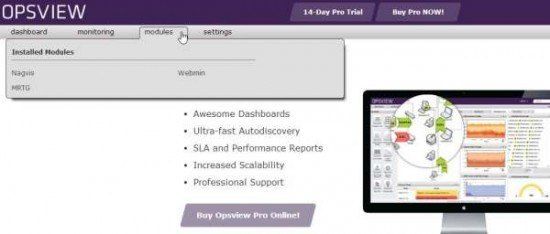
There are two modules included in Core, MRTG and Nagvis
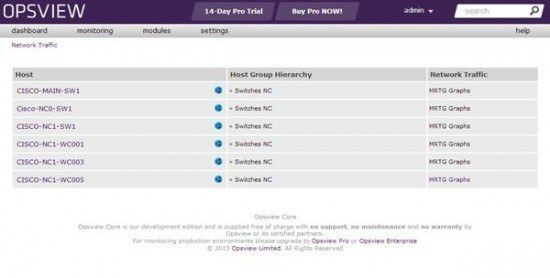
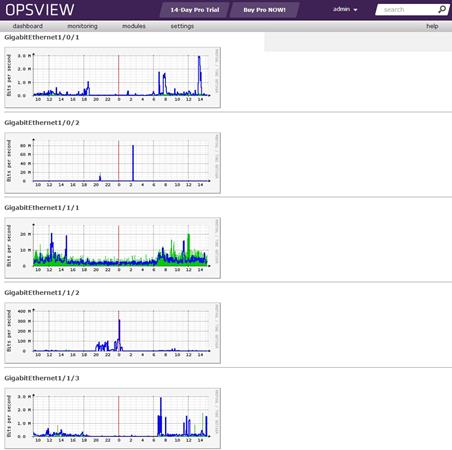
If you would to look at interfaces you need to go to MRTG module, on the right side you can open graph for required device/interface
Every interface has a graph, scroll down and you will see all of your interfaces.
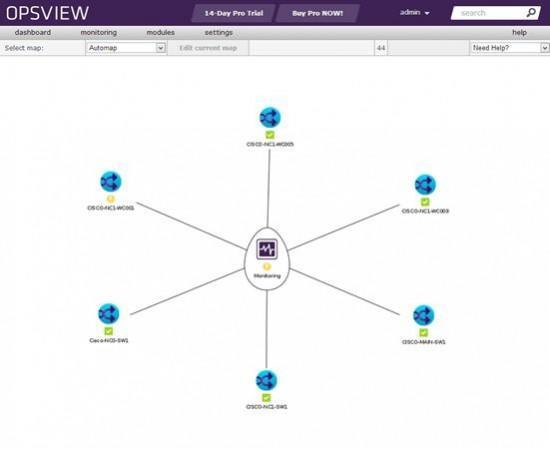
Last module is Nagvis, here you can upload your own map, maybe picture of your rack and add status on it, if device is ok, status is green if there is something wrong with device status will be red. But you can also choose default network map.
Opsview Core conslusion
Opsview Core doesn’t have all the features of it’s PRO sibling, but its free and it’s easy to setup, it’s available as an virtual appliance and that is a big plus. You can be up and running in no time. Perhaps you could save some money if you require only basic monitoring or or you can quickly set it up to test some products. All in all it’s a great free product!


Napsat komentář